On the basis of an assessment of the current and evolving macroeconomic situation at its meeting today, the Monetary Policy Committee (MPC) decided to:
- reduce the policy repo rate under the liquidity adjustment facility (LAF) by 25 basis points from 6.5 per cent to 6.25 per cent with immediate effect.
Consequently, the reverse repo rate under the LAF stands adjusted to 6.0 per cent, and the marginal standing facility (MSF) rate and the Bank Rate to 6.5 per cent.
The MPC also decided to change the monetary policy stance from calibrated tightening to neutral.
These decisions are in consonance with the objective of achieving the medium-term target for consumer price index (CPI) inflation of 4 per cent within a band of +/- 2 per cent, while supporting growth.
The main considerations underlying the decision are set out in the statement below.
Assessment
2. Since the last MPC meeting in December 2018, there has been a slowdown in global economic activity. Among key advanced economies (AEs), economic activity in the US lost some steam in Q4:2018. The outlook for Q1:2019 is clouded by the partial government shutdown, though the labour market conditions remain strong. In the Euro area, economic activity lost momentum on weak industrial activity. The Japanese economy is gradually recovering and an accommodative monetary policy stance is expected to buttress domestic spending.
3. Economic activity also slowed in some major emerging market economies (EMEs). In China, growth decelerated in Q4:2018. Economic activity in Russia lost pace, with soft oil prices posing a downside risk to growth. The Brazilian economy appeared to have ended 2018 on a firmer note, driven by improved domestic spending and exports, though industrial activity continued to struggle to recover from the disruptions of H1:2018. In South Africa, the economic recovery in Q4:2018 remained gradual, tempered by weak industrial activity and subdued exports.
4. Crude oil prices recovered from their December lows in early January on production cuts, but remain below their peak levels in October. Base metals, which witnessed selling pressures in December on persisting uncertainty over US-China trade frictions, recouped losses in January on expectations of thawing of trade disputes and production disruptions. Gold prices have risen, underpinned by safe haven demand in response to geo-political uncertainty and volatility in equity markets. Inflation edged lower in major AEs and many key EMEs.
5. Global financial markets began the year on a calmer note after a turbulent December. Among AEs, equity markets in the US recovered from a sharp sell-off in December, triggered by monetary policy tightening by the Fed, trade tensions and an impending shutdown. EM stock markets, which declined in December on a slew of soft economic data, registered some gains recently on expectations of accommodative monetary policy stances in major economies. The 10-year yield in the US, which fell to a multi-month low in December, rose in January on the edging up of crude oil prices and positive risk sentiment, though softening of the Fed stance restricted the gains. Among other AEs, bond yields in the Euro area and Japan eased on diminishing optimism about global growth. In most EMEs, bond yields have eased as well. In currency markets, the US dollar remained under pressure, though expectations of easing trade tensions provided some support. EME currencies appreciated on the pause in the rate hiking cycle by the Fed and expectations of a positive outcome from US-China trade negotiations.
6. Moving on to the domestic economy, on January 7, 2019 the Central Statistics Office (CSO) released the first advance estimates (FAE) for 2018-19, placing India’s real gross domestic product (GDP) growth at 7.2 per cent – the same level as in 2017-18 (first revised estimates). The FAE for 2018-19 featured an acceleration in gross fixed capital formation (GFCF) and a slowdown in consumption expenditure (both private and government). The drag from net exports is estimated to decline in 2018-19.
7. Some indicators of investment demand, viz., production and imports of capital goods, contracted in November/December. Credit flows to industry remain muted. Available data suggest that while revenue expenditure of the Centre, excluding interest payments and subsidies, contracted in Q3, that of States increased sharply, thus maintaining overall growth in government spending.
8. On the supply side, the FAE have placed the growth of real gross value added (GVA) at 7.0 per cent in 2018-19 as compared with 6.9 per cent in 2017-18. The estimates incorporated a slowdown in agricultural GVA growth and an acceleration in industrial GVA growth. Services GVA growth is set to soften due to subdued activity in trade, hotels, transport, communication and other services. Growth in public administration and defence services is also likely to moderate.
9. Rabi sowing so far (up to February 1, 2019) has been lower than in the previous year, but the overall shortfall of 4.0 per cent across various crops is expected to catch up as the season comes to a close. The lower rabi sowing reflects a deficient north-east monsoon (44 per cent below the long period average); however, storage in major reservoirs – the main source of irrigation during the rabi season – at 44 per cent of the full reservoir level (as on January 31, 2019) was marginally higher than in the previous year. The extended period of cold weather in this year’s winter is likely to boost wheat yields, which would partly offset the shortfall, if any, in area sown.
10. After exhibiting an uptick in the festive month of October, industrial activity, measured by the index of industrial production (IIP), slowed down in November. The year-on-year (y-o-y) growth in core industries decelerated to 2.6 per cent (y-o-y) in December, pulled down by a slowdown in the production of electricity and coal; and contraction in petroleum refinery products, crude oil and fertilisers output. Capacity utilisation (CU) in the manufacturing sector, as measured by the Reserve Bank’s order books, inventory and capacity utilisation survey (OBICUS), increased to 74.8 per cent in Q2 from 73.8 per cent in Q1; seasonally adjusted CU also improved to 75.3 per cent from 74.9 per cent. While the Reserve Bank’s business assessment index of the industrial outlook survey (IOS) for Q3:2018-19 suggests a weakening of demand conditions in the manufacturing sector, the business expectations index (BEI) points to an improvement in Q4. The manufacturing purchasing managers’ index (PMI) for January remained in expansion on the back of increased output and new orders.
11. High-frequency indicators of the services sector suggest some moderation in the pace of activity. Sales of motorcycles and tractors imply weakening of rural demand in December. Sales of passenger cars – an indicator of urban demand – contracted, possibly reflecting volatility in fuel prices and mandated long-term insurance premium payments. Commercial vehicle sales also shrank in December 2018 from a high base of the previous year. Lead indicators for the hotels sub-segment, viz., foreign tourist arrivals and air passenger traffic, point to softening in November-December. In the communication sub-segment, the telephone subscriber base contracted in October-November, while that of broadband continued to expand in October. The services PMI continued to expand in January 2019 despite a dip from the previous month. Indicators of the construction sector, viz., consumption of steel and production of cement, continued to show healthy growth, though growth in cement production inched lower in November 2018, reflecting a base effect.
12. Retail inflation, measured by y-o-y change in the CPI, declined from 3.4 per cent in October 2018 to 2.2 per cent in December, the lowest print in the last eighteen months. Continuing deflation in food items, a sharp fall in fuel inflation and some edging down of inflation excluding food and fuel contributed to the decline in headline inflation.
13. Five constituents of the food group – vegetables, sugar, pulses, eggs and fruits, accounting for about 30 per cent of food group – were in deflation in December. Inflation in respect of other major food sub-groups – cereals, milk, and oils and fats – was subdued. Within cereals, rice prices declined for the fourth consecutive month in December. Inflation in prices of meat and fish and non-alcoholic beverages showed an uptick, while it remained sticky for prepared meals.
14. Inflation in the fuel and light group fell from 8.5 per cent in October to 4.5 per cent in December, pulled down by a sharp decline in the prices of liquefied petroleum gas (LPG), reflecting softening of international petroleum product prices. Kerosene inflation continued to edge up due to the calibrated increase in its administered price.
15. CPI inflation excluding food and fuel decelerated to 5.6 per cent in December from 6.2 per cent in October, dragged down mainly by the moderation in the prices of petrol and diesel in line with the decline in international petroleum product prices. Housing inflation continued to edge down as the impact of the house rent allowance (HRA) increase for central government employees dissipated. However, inflation in several of the sub-groups – household goods and services; health; recreation and amusement; and education – firmed up in December, offsetting much of the impact of lower inflation in petrol, diesel and housing.
16. Inflation expectations of households, measured by the December 2018 round of the Reserve Bank’s survey, softened by 80 basis points for the three-month ahead horizon and by 130 basis points for the twelve-month ahead horizon over the last round, reflecting the continued decline in food and fuel prices. Producers’ assessment of inflation in input prices eased in Q3 as reported by manufacturing firms polled by the Reserve Bank’s industrial outlook survey.
17. Inflation in the prices of farm inputs and industrial raw materials remained elevated, despite some softening. Growth in rural wages moderated in October.
18. The weighted average call rate (WACR) traded below the policy repo rate on 12 out of 20 days in December, all 23 days in January and 4 days in February (up to February 6). The WACR was below the repo rate on an average by 4 basis points in December and 11 basis points each in January and February. Currency in circulation expanded sharply during December and January. The liquidity needs arising out of expansion in currency were met by the Reserve Bank through injection of durable liquidity amounting to ₹500 billion each in December and January through purchases under open market operations (OMOs). Accordingly, total durable liquidity injected through OMOs has aggregated ₹2.36 trillion during 2018-19 so far. Liquidity injected under the LAF was ₹996 billion in December on an average daily net basis, and ₹329 billion in January. In February, however, the average daily liquidity position turned into surplus with an average absorption of ₹279 billion.
19. Export growth on a y-o-y basis was almost flat in November and December 2018, primarily due to a high base effect and weak global demand. While growth in exports of petroleum products remained positive, non-oil exports declined, dragged down by lower shipments of gems and jewellery, engineering goods, meat and poultry. Import growth slowed in November and turned negative in December 2018. While imports of petroleum (crude and products) rose in line with the increase in import volumes, non-oil imports such as pearls and precious stones, gold, electronic goods and transport equipment, recorded declines. The merchandise trade deficit for April-December 2018 was a shade higher than its level a year ago. Net services exports picked up in October and November 2018, which combined with low oil prices, could have a salutary impact on the current account deficit in Q3. On the financing side, net FDI flows to India during April-November 2018 were higher than a year ago. Foreign portfolio flows turned negative in January 2019, after rebounding in November and December 2018. India’s foreign exchange reserves were at US$ 400.2 billion on February 1, 2019.
Outlook
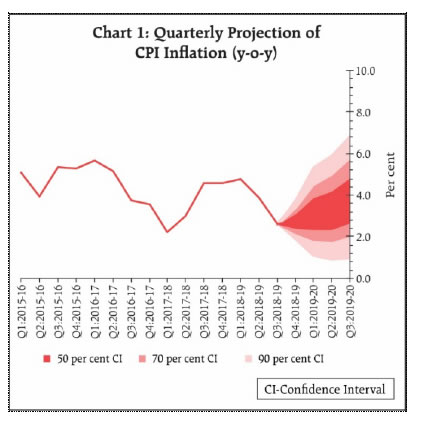
20. In the fifth bi-monthly monetary policy resolution in December 2018, CPI inflation for 2018-19 was projected in the range of 2.7-3.2 per cent in H2:2018-19 and 3.8-4.2 per cent in H1:2019-20, with risks tilted to the upside. The actual inflation outcome at 2.6 per cent in Q3:2018-19 was marginally lower than the projection. There have been downward revisions in inflation projections during the course of the year, reflecting mainly the unprecedented soft inflation recorded across food sub-groups.
21. Several factors will shape the inflation path, going forward. First, food inflation has continued to surprise on the downside with continuing deflation across several items and a significant moderation in inflation in cereals. Several food groups are experiencing excess supply conditions domestically as well as internationally. Hence, the short-term outlook for food inflation appears particularly benign, despite adverse base effects. Secondly, the moderation in the fuel group was larger than anticipated. Inflation in items of rural consumption such as firewood and chips, which had remained sticky and at elevated levels, has collapsed in recent months. Electricity prices also showed an unexpected moderation, providing a softer outlook for the fuel group. Thirdly, while inflation excluding food and fuel remains elevated, the recent unusual pick-up in the prices of health and education could be a one-off phenomenon. Fourthly, the crude oil price outlook remains broadly the same as in the December policy. Fifthly, the Reserve Bank’s surveys show that inflation expectations of households as well as input and output price expectations of producers have moderated significantly. Finally, the effect of the HRA increase for central government employees has dissipated completely along expected lines. Taking into consideration these developments and assuming a normal monsoon in 2019, the path of CPI inflation is revised downwards to 2.8 per cent in Q4:2018-19, 3.2-3.4 per cent in H1:2019-20 and 3.9 per cent in Q3:2019-20, with risks broadly balanced around the central trajectory.
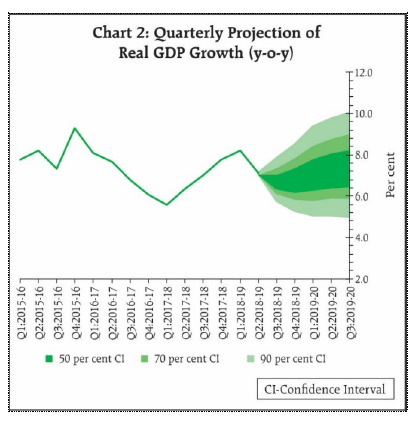
22. Turning to the growth outlook, GDP growth for 2018-19 in the December policy was projected at 7.4 per cent (7.2-7.3 per cent in H2) and at 7.5 per cent for H1:2019-20, with risks somewhat to the downside. The CSO has estimated GDP growth at 7.2 per cent for 2018-19. Looking beyond the current year, the growth outlook is likely to be influenced by the following factors. First, aggregate bank credit and overall financial flows to the commercial sector continue to be strong, but are yet to be broad-based. Secondly, in spite of soft crude oil prices and the lagged impact of the recent depreciation of the Indian rupee on net exports, slowing global demand could pose headwinds. In particular, trade tensions and associated uncertainties appear to be moderating global growth. Taking into consideration the above factors, GDP growth for 2019-20 is projected at 7.4 per cent – in the range of 7.2-7.4 per cent in H1, and 7.5 per cent in Q3 – with risks evenly balanced.
23. Headline inflation is projected to remain soft in the near term reflecting the current low level of inflation and the benign food inflation outlook. Beyond the near term, some uncertainties warrant careful monitoring. First, vegetable prices have been volatile in the recent period; reversal in vegetable prices could impart upside risk to the food inflation trajectory. Secondly, the oil price outlook continues to be hazy. Thirdly, a further heightening of trade tensions and geo-political uncertainties could also weigh on global growth prospects, dampening global demand and softening global commodity prices, especially oil prices. Fourthly, the unusual spike in the prices of health and education needs to be closely watched. Fifthly, financial markets remain volatile. Sixthly, the monsoon outcome is assumed to be normal; any spatial or temporal variation in rainfall may alter the food inflation outlook. Finally, several proposals in the union budget for 2019-20 are likely to boost aggregate demand by raising disposable incomes, but the full effect of some of the measures is likely to materialise over a period of time.
24. The MPC notes that the output gap has opened up modestly as actual output has inched lower than potential. Investment activity is recovering but supported mainly by public spending on infrastructure. The need is to strengthen private investment activity and buttress private consumption.
25. Against this backdrop, the MPC decided to change the stance of monetary policy from calibrated tightening to neutral and to reduce the policy repo rate by 25 basis points.
26. The decision to change the monetary policy stance was unanimous. As regards the reduction in the policy repo rate, Dr. Ravindra H. Dholakia, Dr. Pami Dua, Dr. Michael Debabrata Patra and Shri Shaktikanta Das voted in favour of the decision. Dr. Chetan Ghate and Dr. Viral V. Acharya voted to keep the policy rate unchanged. The MPC reiterates its commitment to achieving the medium-term target for headline inflation of 4 per cent on a durable basis. The minutes of the MPC’s meeting will be published by February 21, 2019.
27. The next meeting of the MPC is scheduled from April 2 to 4, 2019.
(सौ. आरबीआई)


